Analyzing and Comparing Results
In this article
- Opening and learning all about Results pages
- Interpreting Metrics.
- Filtering, editing, and comparing visualizations.
- Analyzing and deleting individual responses.
- Exporting Results.
- Sharing Results.
- Creating Reports from your Results pages.
Suggested next article: Analyzing and Tagging Text Responses and Managing Contacts.
Opening and learning all about Results pages
The Results page presents an aggregate summary of every response for each survey in your account that has collected results — Published or Closed.
To open a Results page:
- 1
- Click "My surveys"
- 2
- Click on any of your survey's index cards → (and open the "Results" page for that survey)
-


The key elements of the Results page are:
| 1 | Results | (No surprise here!) The Results page will populate your survey’s metrics and update the aggregate visualizations for each question |
| 2 | Metrics | Your survey’s performance metrics are compiled at the top of the Results page (See Interpreting metrics below) |
| 3 | Visualizations | Scroll down your Results page → and view all of your visualizations! |
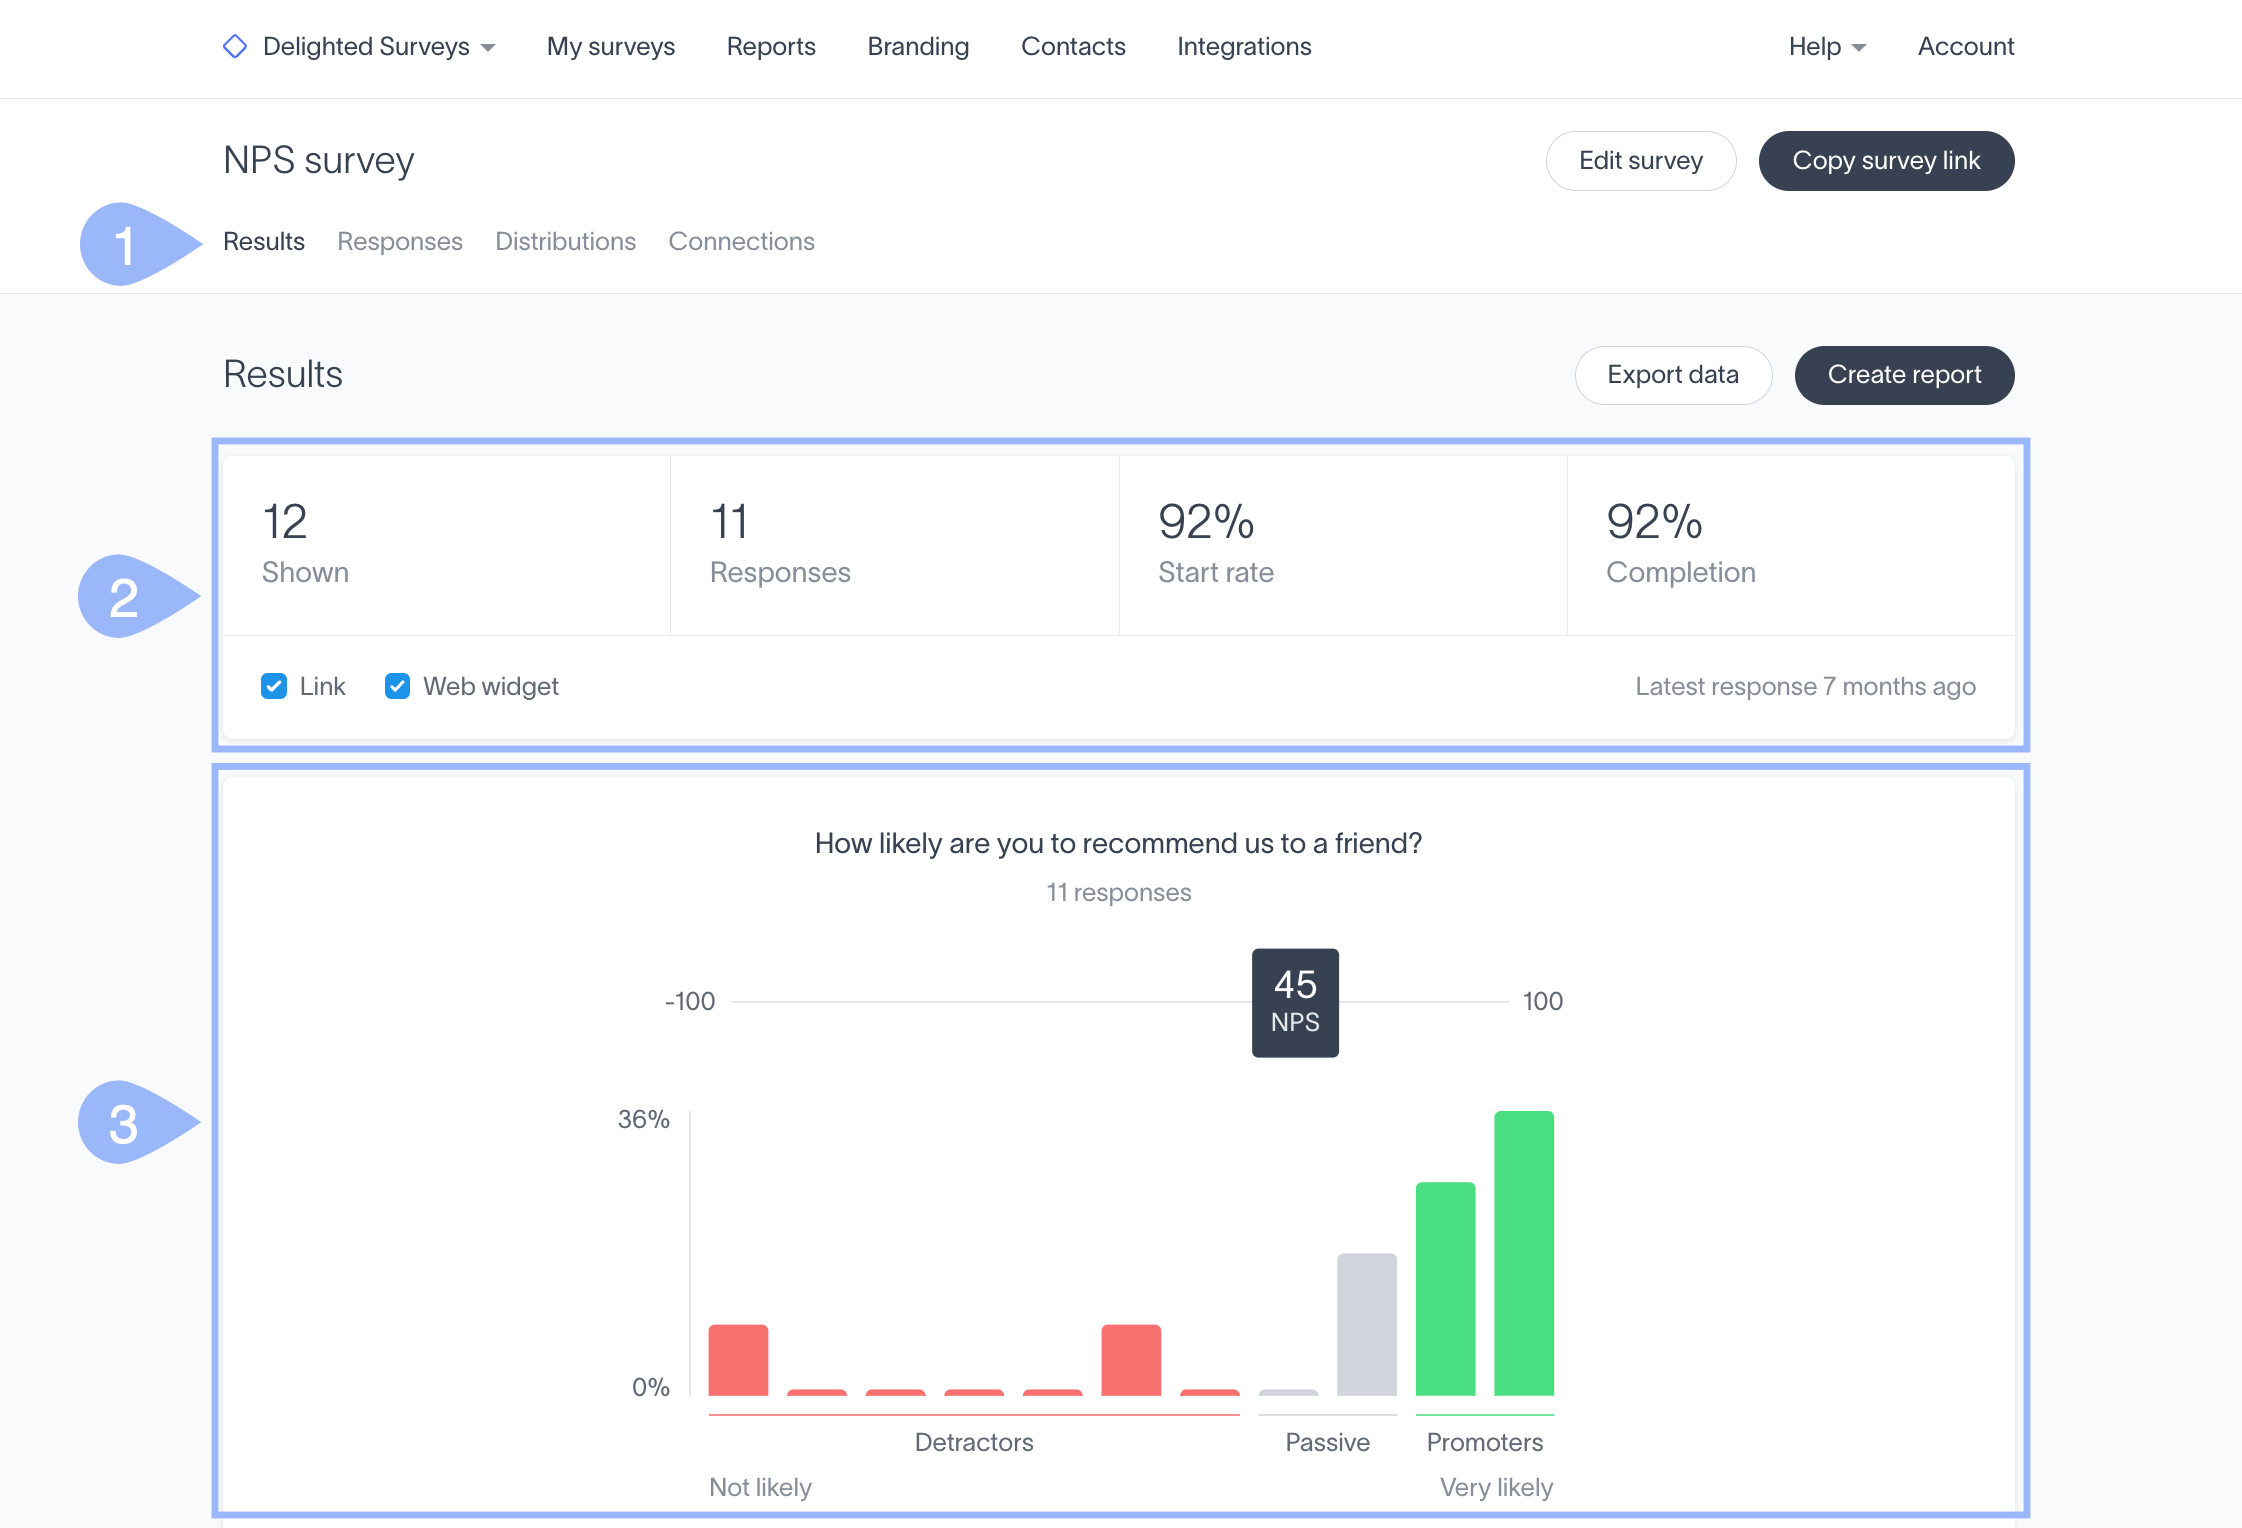
| 4 | Responses | Click "Responses" to view (wait for it) → individual response cards that contain all of details about an individual response. There are also Export, Sharing, and Report building options on each card |
About predictive visualizations
The Results page will predict which representation best fits a question’s format. For example, a numeric 11-point scale question conjures this informative chart highlighting NPS Detractors, Passives, and Promoters. (It's a seriously informative NPS visualization.)

Other visualizations, like those for demographic questions, are a slam dunk for Delighted Surveys — which excels in delivering eye-catching, informative charts and graphs.

To expand and flip through your charts and tables one at a time:
- 1
- Expand a chart by hovering until the "expand arrows" appear → then click the card
-

- 2
- Flip forward to the next visualization → by clicking "Next result"
-

- 3
- Flip back through the visualizations → by clicking "Previous result"
-


Opening your Results for Published AND Closed surveys
To view the Results page for any survey that has collected results — "Published" or "Closed":
- 1
- Click "My surveys" → and pick "Published" or "Closed"
- 2
- Click your target survey's index card → (to open the "Results" page for that survey)
-
-
Note: Finalized surveys have a "Copy" survey link and a quick link to the "Configure Web widget" panel button at the bottom of their index cards! 

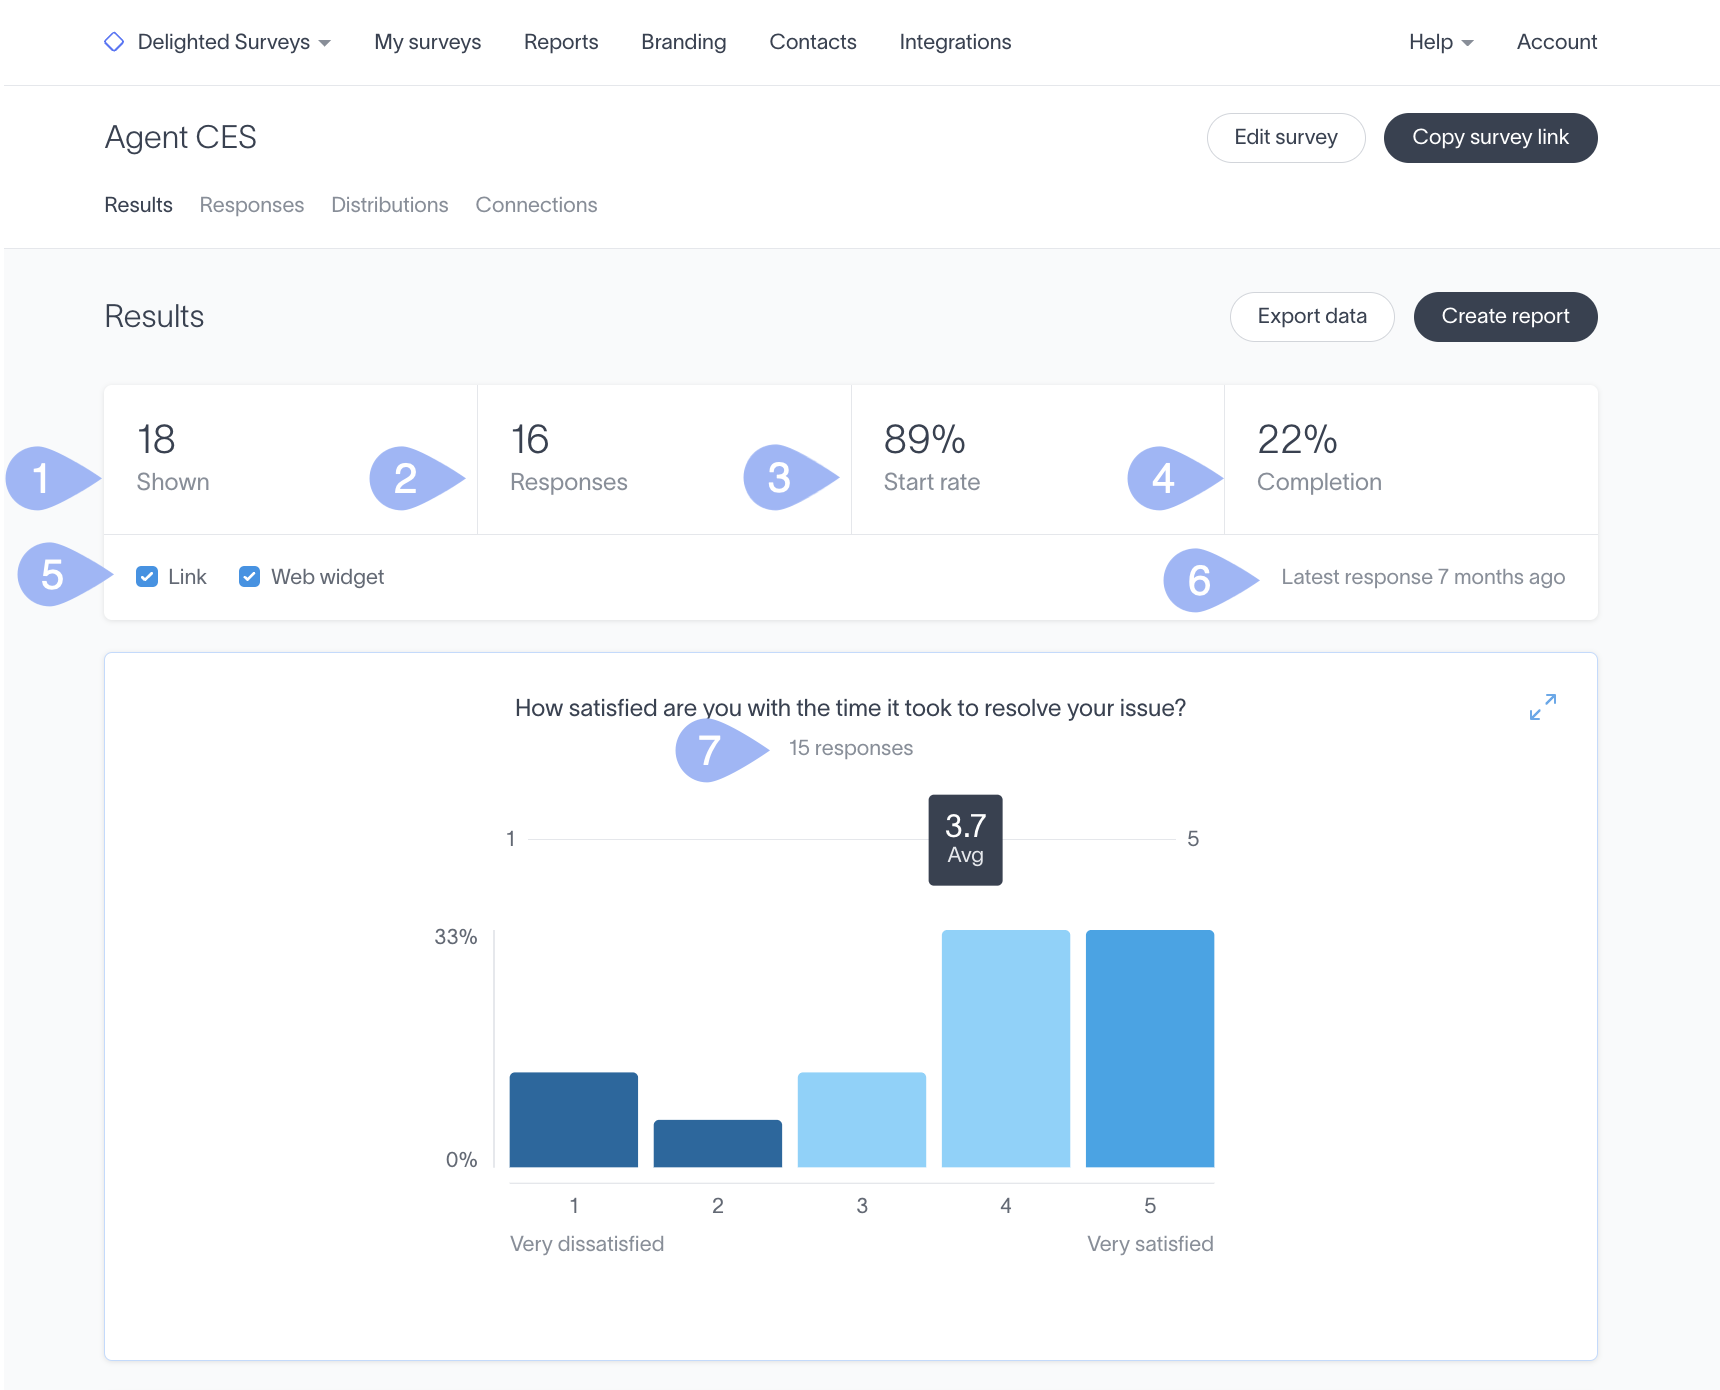
Interpreting Metrics
Engagement metrics are calculated automatically and are displayed at the top of each Results page.
To view a survey’s engagement metrics:
- 1
- Open your survey’s "Results" page
- 2
- Evaluate the metrics displayed near the top of the page → as explained below
| 1 | Shown | How many times the survey has been shown to prospective respondents |
| 2 | Responses | How many respondents started the survey by answering at least one question |
| 3 | Start rate | The percentage of respondents that started the survey by answering at least one question |
| 4 | Completion rate | The percentage of respondents that have completed the entire survey by answering every question |
| 5 | Distributions | In this image, both the "Link" and "Web widget" distributions are enabled for the selected survey |
| 6 | Latest response | When was the last response submitted; as posted in hours and minutes |
| 7 | Question metric | How many respondents have answered an individual question |
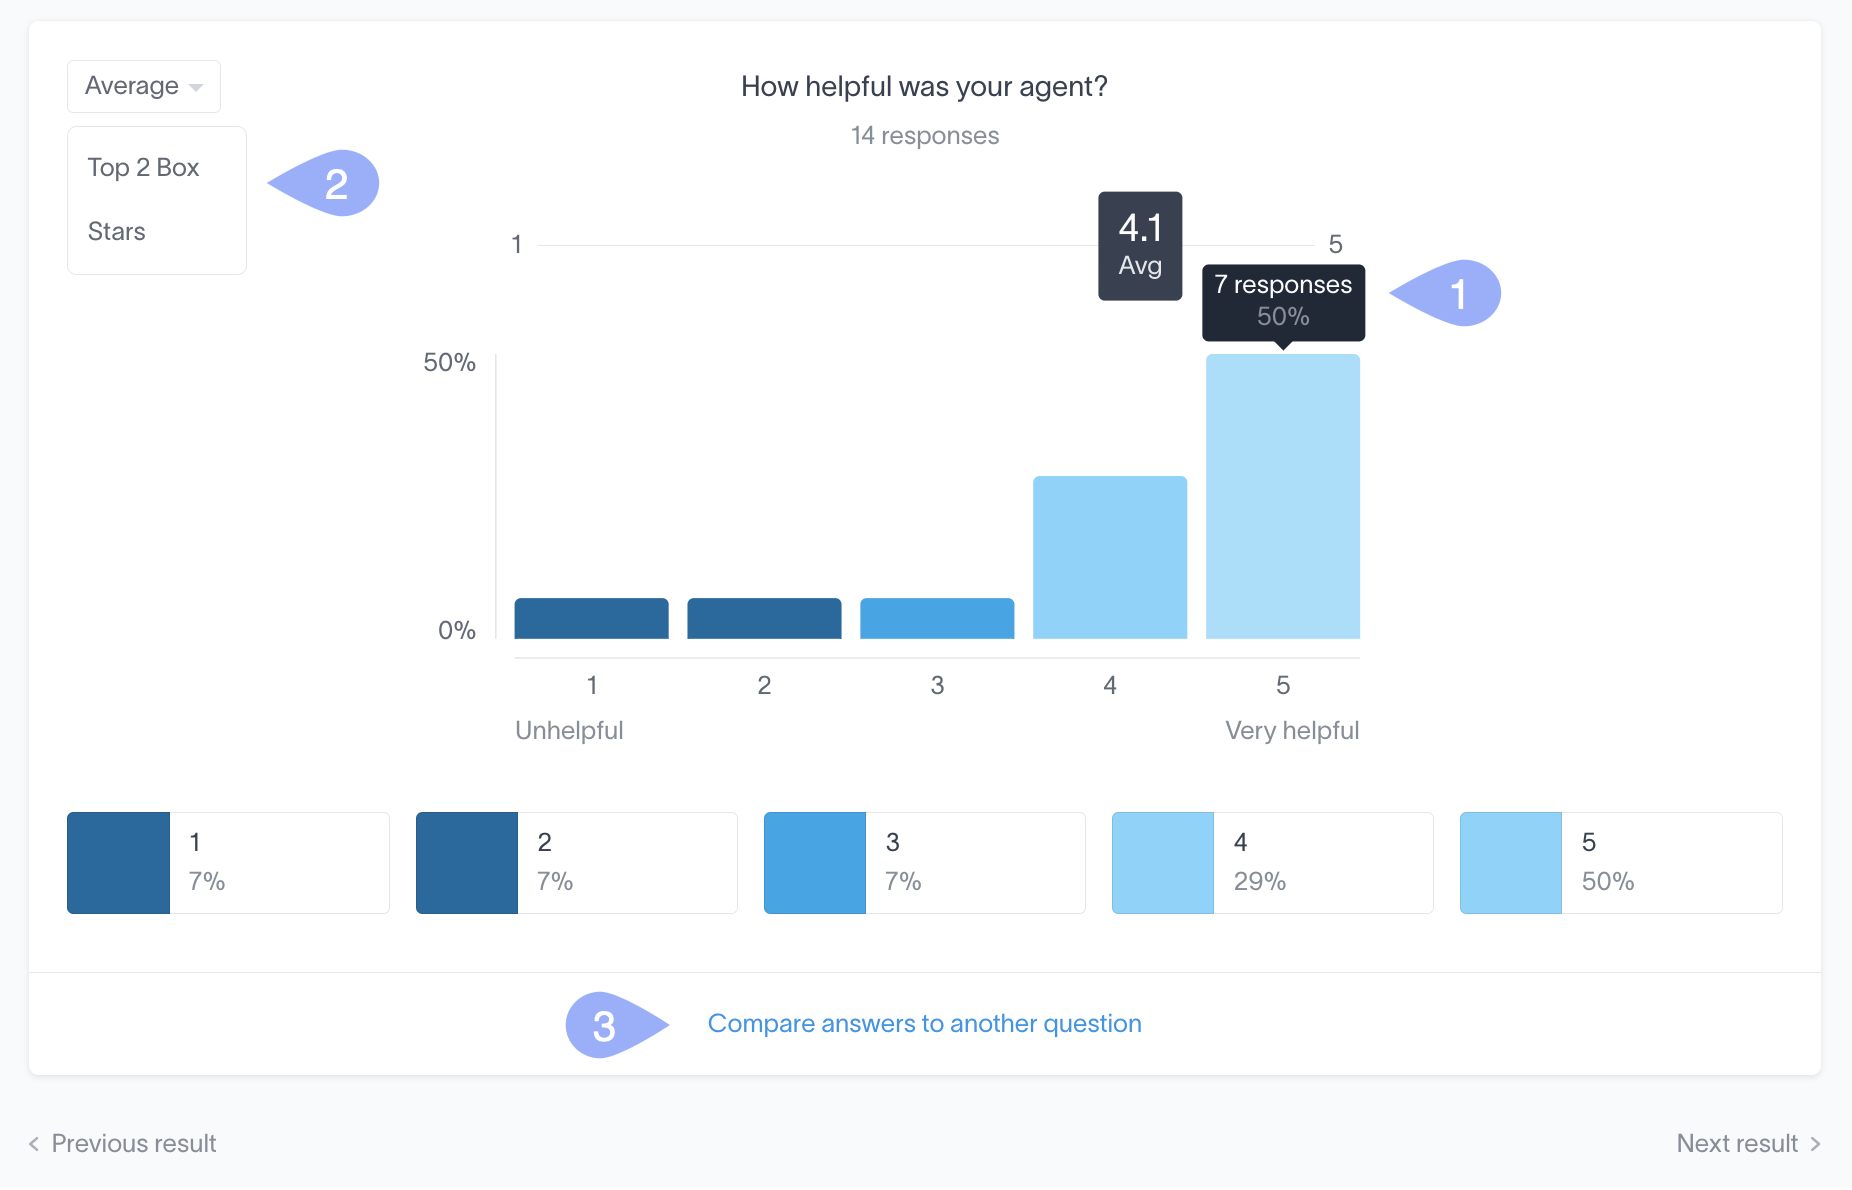
Filtering, editing, and comparing visualizations
Expanding a visualization will open up a range of reporting options. Expand any visualization on your Results page by simply clicking on it!
From the expanded view you can:
| 1 | Filter responses to a question |
| 2 | Switch to alternate charts |
| 3 | Compare two questions |
1. Filtering responses to a question
Click on a specific answer choice, either in the chart or in the legend, to filter the visualization. The response count will update to reflect the number of respondents who chose that particular answer choice. Click again to remove the filter!
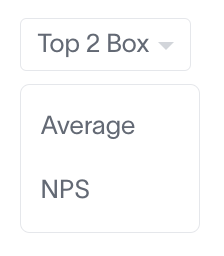
2. Switching to alternate charts
Many charts offer alternate visualization types. This can be helpful if the predictive visualization is not right for your question; for example, if your 11-point scale question is asking something other than an NPS "likely to recommend" question.
Click on the visualization and change the chart type with the drop-down menu in the top left corner to make a switch, as shown here for the NPS options.
-
Alternate formats revert back to the default — unless added to a report An alternative chart reverts to its original when you return to the Results page. To permanently capture an alternative chart, add it to a report as detailed in Creating and Sharing Reports.
3. Comparing questions
Juxtapose one set of results with another to highlight important insights and correlations. For example, see the average satisfaction rating for customers who shopped in a store versus those who shopped online.
To compare the results from two questions:
- 1
- Click on any visualization → from the "Results" page
- 2
- Choose "Compare answers to another question"
- 3
- Pick a comparable question from the list

-
More about comparative visualizations Comparative visualizations:
- Are available for all question types except open text
- Will revert back to their original forms as you return to the Results page
- Can only be captured permanently if you add them to a report → as detailed in Creating and Sharing Reports
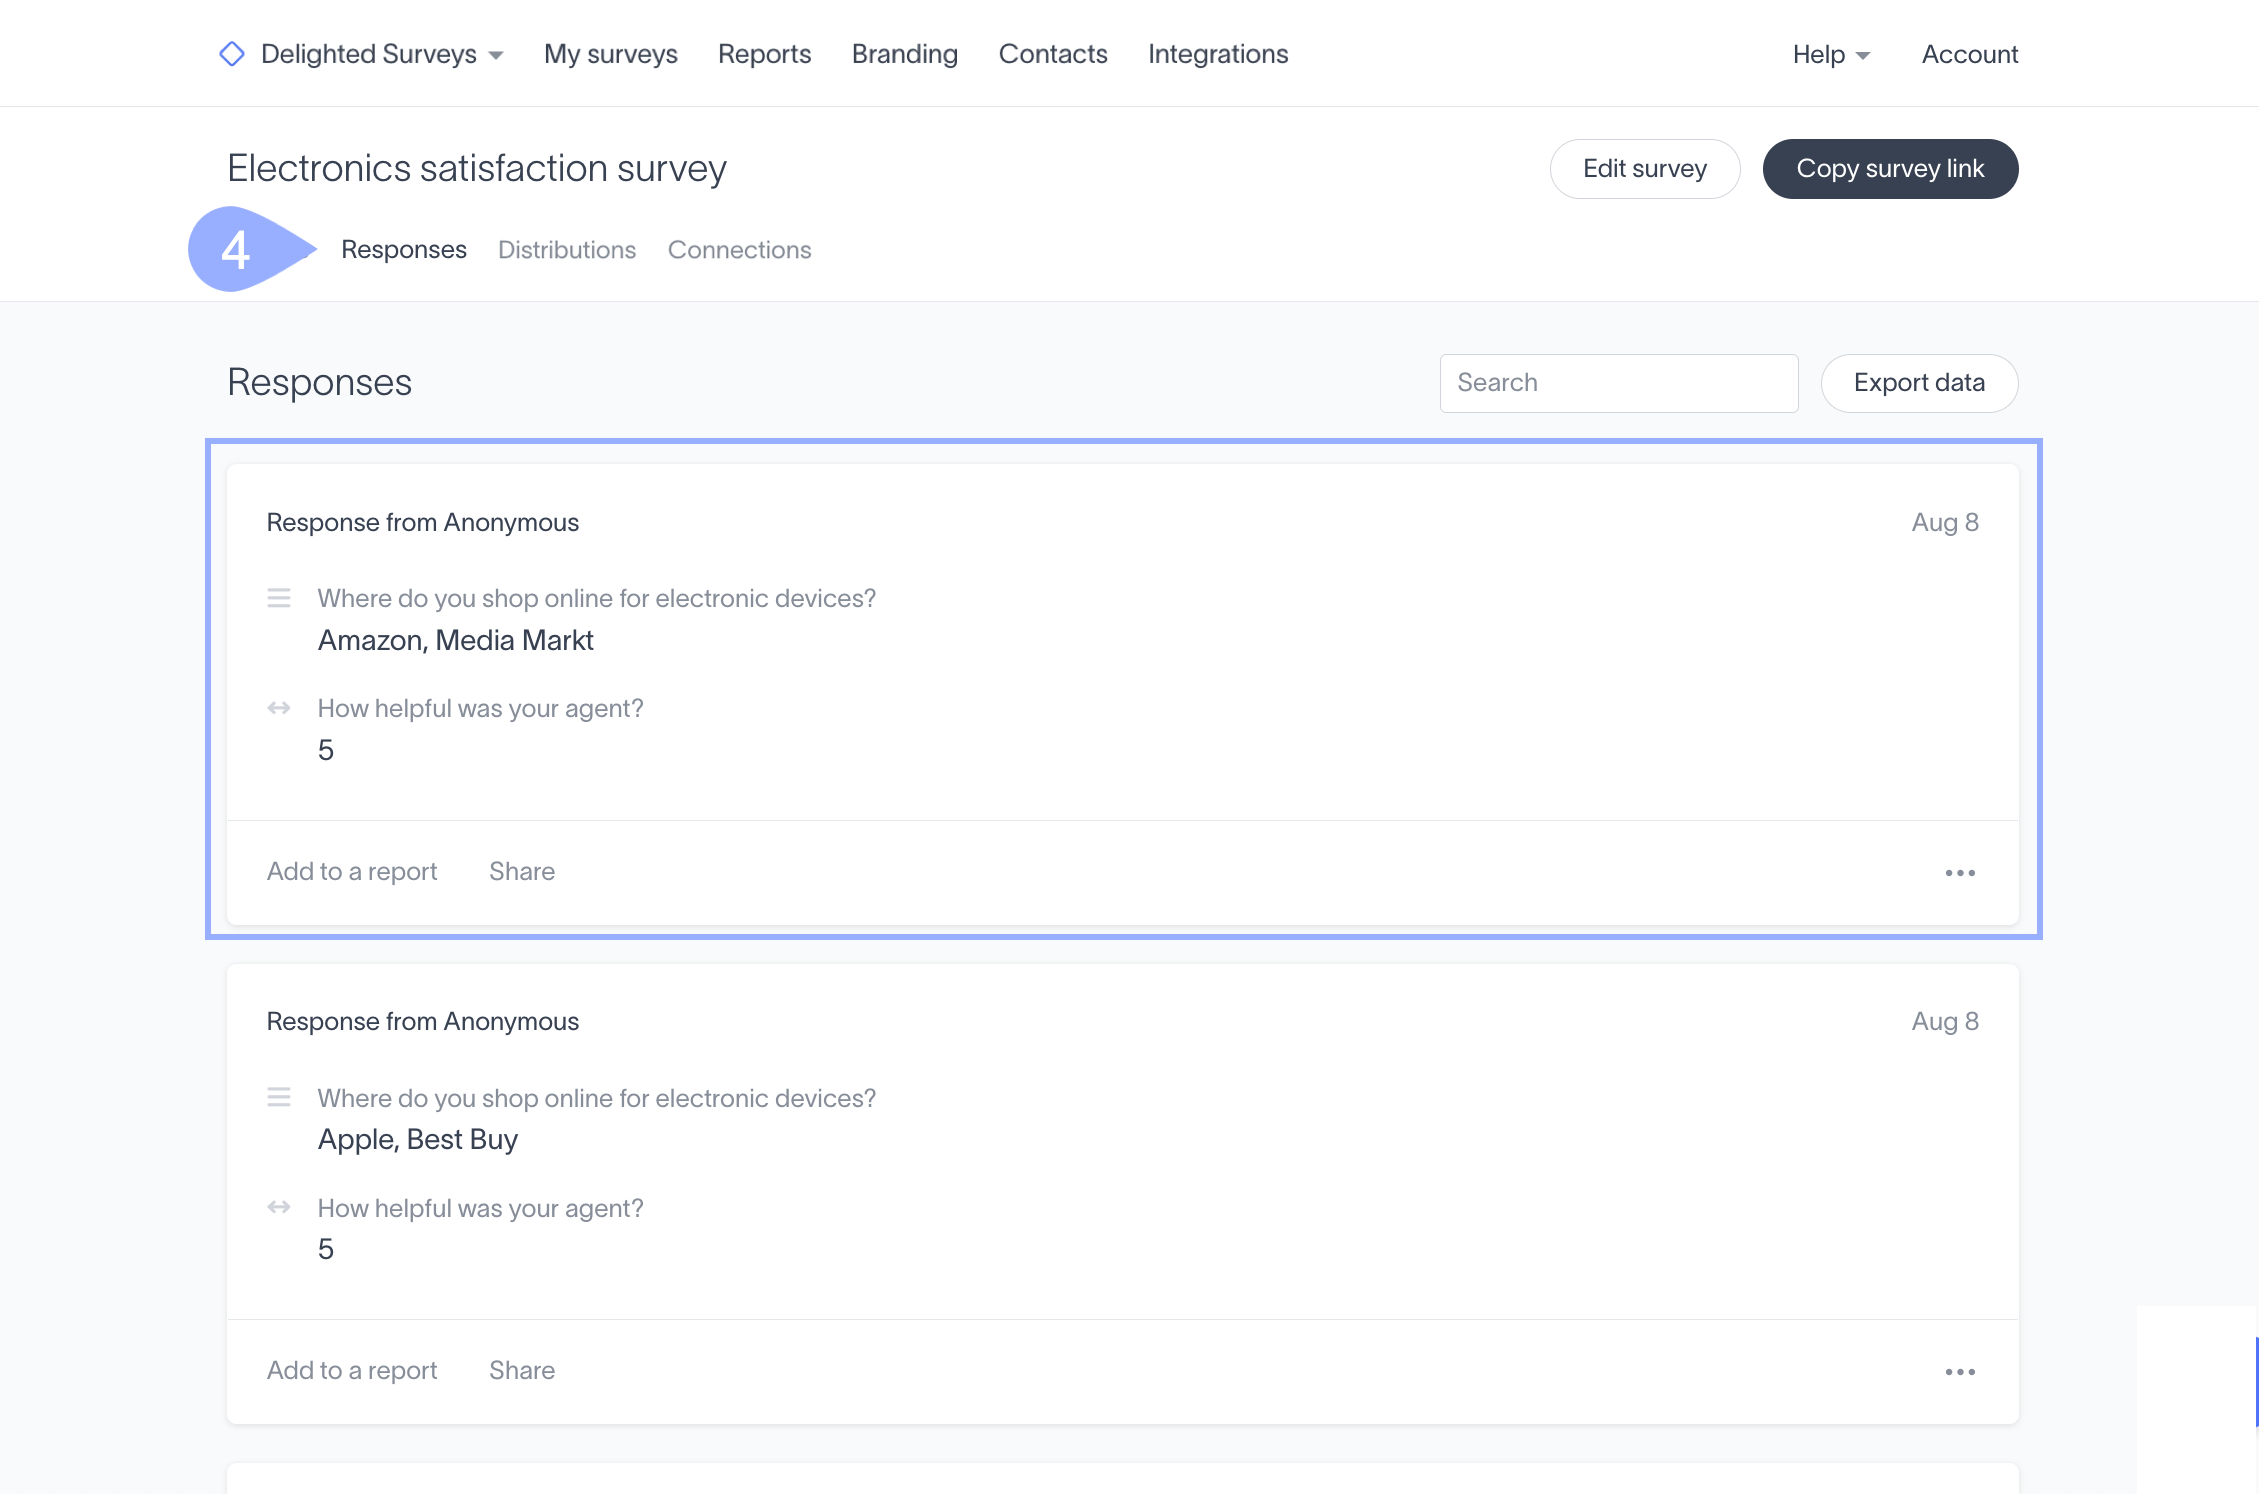
Analyzing and deleting individual responses
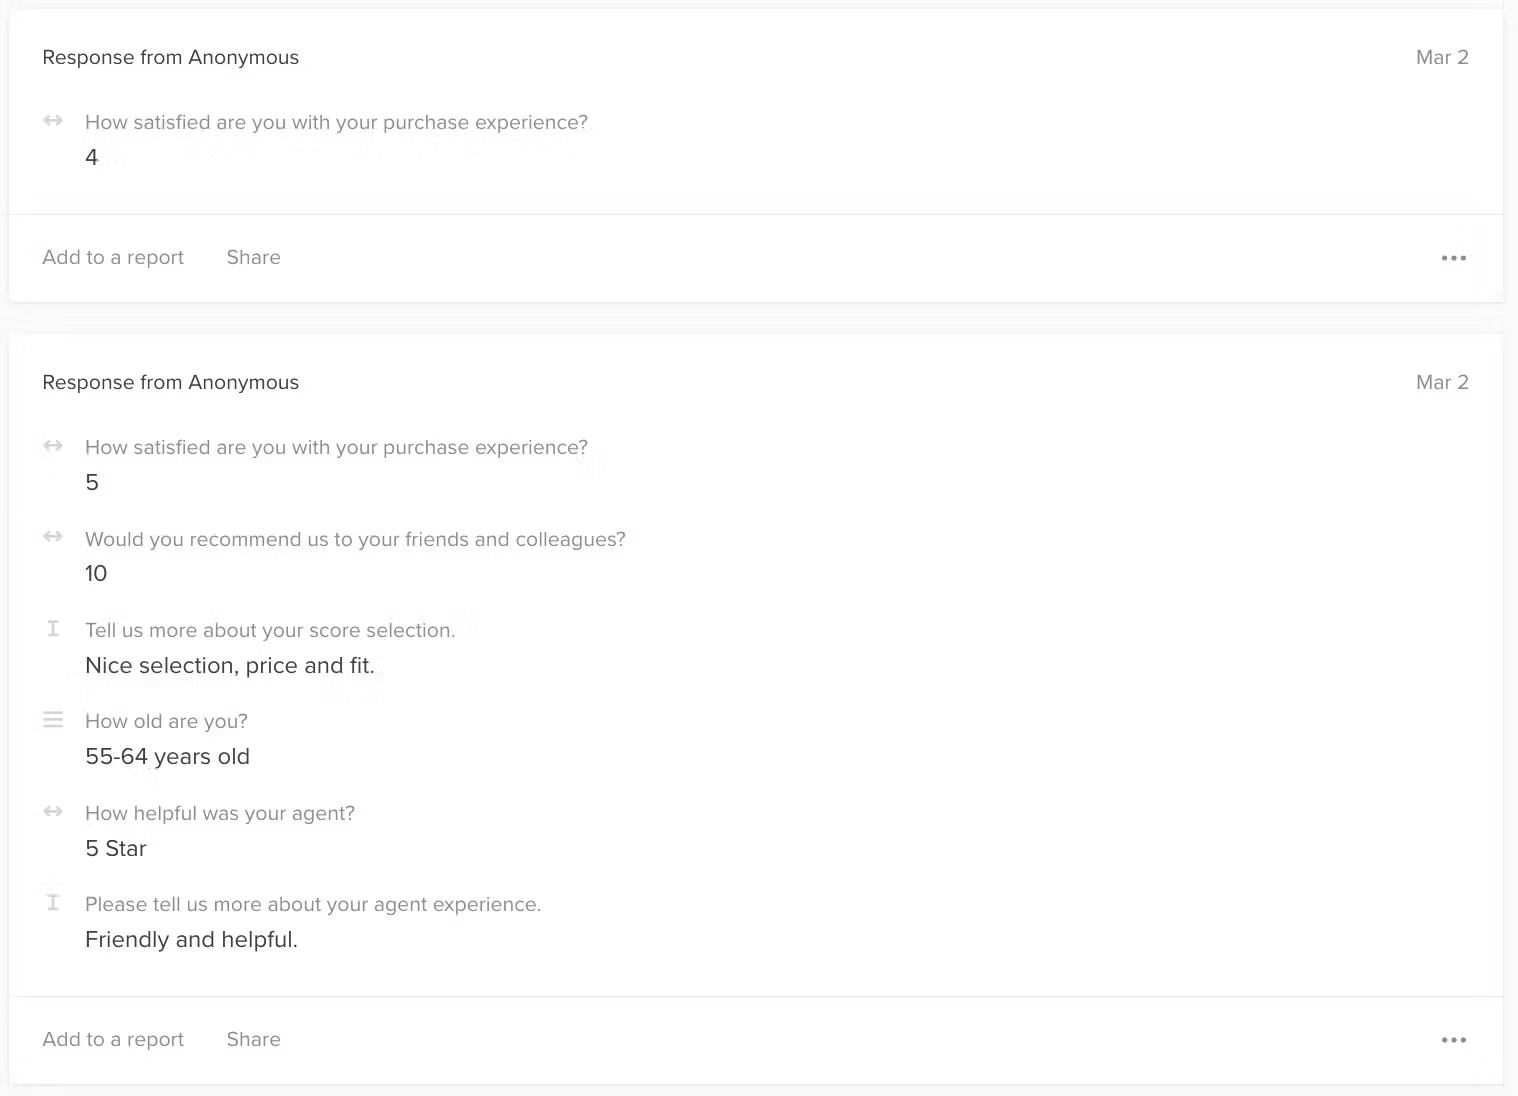
A Response card is generated for every response to your survey. Each individual response is accessible under the Responses tab where you can view, share, and delete the data.
Separate cards are created regardless of how complete, or incomplete, respondent answers may be — as seen in these two examples.
-
About anonymous surveys and links
Delighted Surveys are distributed via "anonymous" links or URLs, so response cards list them as such.
To collect names, email addresses, phone numbers, or other personal information, ask a Recommended Demographic question, which allow participants to enter their personal information voluntarily. (See 2. Selecting from the Recommended questions library)
You can also pass the respondent's email address through the survey URL as explained in Capturing respondent email addresses in the Publishing and Sending Surveys section.
Understanding individual responses
From your response cards you can:
- 1
- Identify the source of the response
- 2
- View the date the response was submitted
- 3
-
Scroll over the icons to see which format was used for each question → (ex. a "Multiple choice, select many" list of options)
- 4
- Click "Add to a report: → which will append the selected response to a report
- 5
- "Share" an individual response card with others

Deleting responses
To delete a response:
- 1
- Click "Responses" → and scroll down to your target response card
- 2
- Click the "ellipsis" in the corner of the response card → and pick "Delete response"
- 3
- Click "Yes, delete response" → thereby removing it from a survey’s dataset, an action that cannot be undone (Click the "X" to cancel this action)

Exporting Results
Exporting will send a complete copy of your results to the email address associated with your account in a CSV file. CSV is shorthand for comma-separated values — a very common spreadsheet format, compatible with every major spreadsheet app (ex. Excel, Sheets, Numbers, and more).
There are two available export types:
| 1 | Results tab | Export a summarized version of your data, including counts of each answer choice for each question |
| 2 | Responses tab | Export a list of every individual response with the exact answers to each question |
To export your data:
- 1
- Open the "Results" page → by clicking the survey's index card
- 2
- As desired, click either "Results" or "Responses" → to export either summaries or individual responses, as explained in the above table
- 3
- Click "Export data" → (Note: Your export will appear in your Account's email inbox)

Sharing Results
Sharing individual charts and responses with stakeholders can be very impactful. Your shared links can be accessed by anyone, even if they aren't a Delighted user, making it easy to disseminate results across your organization!
To share:
- 1
- Click either the "Results" or "Responses" tab
- 2
- Scroll to your targeted visualization or individual response card
- 3
- Click "Share"
- 4
- "Copy" the link
- 5
- Share the link!

-
About sharing your results link Post your link into messages, social media, email, Slack — you name it. Apps that are oEmbed enabled will create an visual representation of your shared link. Colleagues will instantly see an embedded visualization of your results without needing to click the link. How handy is that!


Creating Reports from your Results pages
There are so many exciting features and reporting options that we’ve written a separate article to tell you all about them. Learn the tips and tricks in Creating and Sharing Reports.